
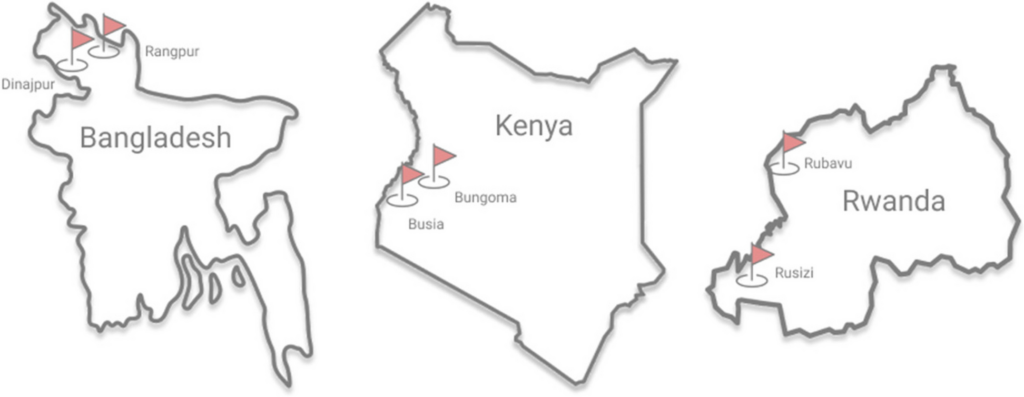
Overall, we interviewed and included in our analysis 307 households in Dinajpur, 299 in Rangpur, 151 in Busia, 150 in Bungoma, 150 in Rubavu, and 150 in Rusizi. The majority of households reported a male household head, namely 89.9% in Dinajpur, 93.3% in Rangpur, 82.0% in Bungoma, 78.9% in Busia, 84.0% in Rubavu, and 80.0% in Rusizi. The gender, average age, and level of education (no school, and primary, secondary, and tertiary education) of the household head in each city population are shown in Table 1.
Table 1 Education status among household heads in NICE citiesAgriculture, livestock and water
Farming activities were assessed through the owning or accessing of agricultural land. Important to note, most of the participants reported an additional occupation and source of income besides these agricultural activities. However, in Bangladesh, 69.4% of the households in Dinajpur were involved in farming, 77.9% of them had less than 12 acres of farmland (smallholder farm) and 23.9% of them had 2 acres or less (marginal farm). In Rangpur 74.3% were involved in farming, 70.6% of them had less than 12 acres and 22.1% had 2 acres or less. In Kenya, 63.3% of the households in Bungoma and 66.0% in Busia were involved in farming; 100% in both cities had smallholder farms of which 86.4% and 88.3% were marginal farms, respectively. In Rwanda, 58.0% of the households in Rubavu and 59.3% in Rusizi were involved in farming; 31.5% and 25.4% in smallholder farms whereof 16.6% and 20.6% were marginal farms, respectively. The farmland in the Bangladeshi cities was mainly located in urban areas, in the African cities the majority was in the peri-urban or rural areas (Fig. 2). Only few of the responding households had received loans or support for agriculture (cash or in kind) during the past year; for Bangladesh, 1.3% in Dinajpur and Rangpur each; for Kenya, 4.0% in Bungoma, 6.0% in Busia; and for Rwanda, 5.3% in Rubavu and 14.7% in Rusizi, mostly from NGOs, funds or government sources.
Fig. 2
Location (urban, peri-urban or rural) of farmland owned or accessed by the interviewed households of the NICE cities (Bangladesh (Rangpur and Dinajpur), Kenya (Bungoma and Busia), and Rwanda (Rubavu and Rusizi))
For Bangladesh, in Dinajpur, 30.9% of the households possessed livestock, mainly chicken (17.3%), goats (12.7%), cattle (8.8%), and ducks (5.5%). In Rangpur, 26.8% of the households had livestock, mainly chicken (11.0%), goats (8.4%), ducks (6.7%), and cattle (4.3%). For Kenya, in Bungoma, 57.3% of the households possessed livestock, mainly chicken (56.0%), cattle (17.3%), goats (11.3%), and pigs (4.7%). In Busia, 58.0% of the households had animals, mainly chicken (34.7%), cattle (19.3%), goats (12.7%), and pigs (3.3%). For Rwanda, in Rubavu, 35.3% of the households possessed livestock, mainly chicken (13.3%), cattle (10.7%), pigs (10.7%), goats (6.0%), sheep (2.7%), and rabbits (2.0%). In Rusizi, 50.0% of the households had animals, mainly pigs (23.3%), cattle (21.3%), chicken (16.0%), goats (8.7%), sheep (5.3%), and rabbits (4.0%).
In Bangladesh, most households accessed a bore hole to source their drinking water, whereas in Kenya and Rwanda more often protected or unprotected well or springs, public standpipes, piped into a dwelling or plot, and surface water were used (see Table 2). Furthermore, for Bangladesh the majority of households had a flush toilet, in Dinajpur 45.9% had a flush toilet to a septic tank, 37.8% to a pit and 1.3% to a piped sewage system; another 3.9% used a traditional pit latrine and 11.1% a ventilated improved pit latrine (VIP). In Rangpur, 40.1% had a flush toilet to a septic tank, 45.2% to a pit and 4.0% to a piped sewage system; another 1.7% used a traditional pit latrine and 8.4% a VIP, 0.7% had no facility. For Kenya, in Bungoma 40.0% of the households used a traditional pit latrine, 35.3% a VIP, 10.0% a flush toilet to a piped sewing system, 10.0% a flush toilet to a septic tank, and 4.0% a flush toilet to a pit. In Busia, 39.3% of the households used a traditional pit latrine, 42.0% a VIP, 8.7% a flush toilet to piped sewing system, 8.0% a flush toilet to septic tank, and 1.3% a flush toilet to a pit. For Rwanda, in Rubavu the vast majority of households used a traditional pit latrine (81.3%), some a flush toilet to pit (13.3%), 3.3% had no facility and 2.0% use the neighboring facility. In Rusizi, 83.3% owned a pit latrine, 16.0% a flush toilet to a pit, and 0.7% had no facility.
Table 2 Sources of drinking water in the households of the NICE citiesFood consumption and purchasing patterns
Many households were food insecure, defined as not being able to eat the desired variety, quality or quantity of foods. The indication for food insecurity (assessed by HFIAS) substantially increased during the COVID-19 pandemic in all cities. In Dinajpur from 34.9% before the pandemic to 54.1% during the pandemic, in Rangpur from 33.4% to 55.2%, in Bungoma from 77.3% to 88.7%, in Busia from 76.0% to 88.7%, in Rubavu from 81.3% to 98.7%, and in Rusizi from 86.0% to 99.3%. Median (interquartile range (IQR)) weekly household expenditure from salary for food during the pandemic varied from 36.9% (30.0–50.1) in Rangpur to 65.2% (37.0–100.0) in Rusizi, see Table 3. Especially in Rwanda, several households reported to spend all their weekly income on food, although not spending any money for some food groups such as dairy or also meat and fish. Overall, most people indicated to consume mainly local food. In Bangladesh the purchase of imported fruits and legumes was common, also the Kenyan cities Busia and to some extent Bungoma reported to consume some substantial amounts of imported foods (Table 4).
Table 3 Median (interquartile range) weekly household expenditures for food as percentage of weekly salary expended for different food groups per weekTable 4 Provenance of food as percentage of food of local, national and imported provenance in NICE cities
The Household Dietary Diversity Score (HDDS) varied from the consumption of an average of 4.0 ± 1.9 out of 12 food categories in Rubavu (Rwanda), to 7.9 ± 1.6 food categories consumed in Rangpur (Bangladesh, Fig. 3). Households lead by a male household head in Kenya and Rwanda had the tendency of a higher mean HDDS (6.0 and 4.1) compared to households with a female head (5.3 and 3.8). In Bangladesh, households with a female household head tended to have a higher HDDS compared to male headed households (8.1 compared to 7.7). In Rwanda few households consumed processed foods at home in the previous 24 h the least frequent (8.0% in Rubavu and 16.0% in Rusizi), on the other side in Kenya and Bangladesh more than half of the households reported the consumption of processed foods at home (58.9% in Busia, 57.3% in Bungoma, 61.0%in Dinajpur, and 71.8% in Rangpur).
Fig. 3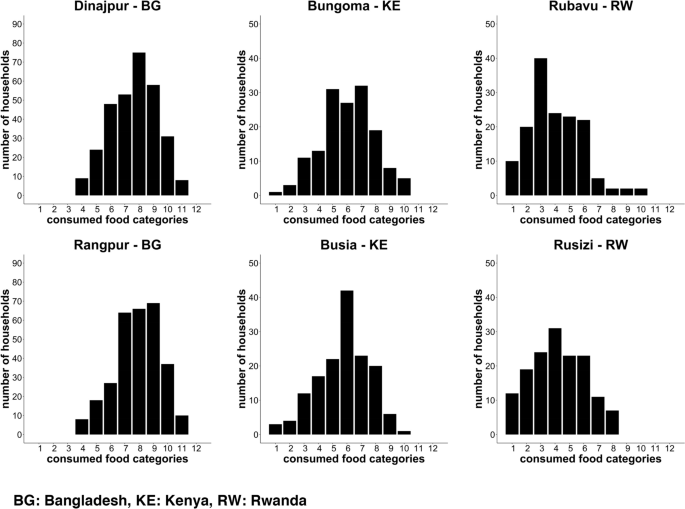

Household Dietary Diversity Score in the NICE cities
The Minimum Dietary Diversity for Women (MDD-W) score varied from the consumption of a mean of 3.8 ± 1.4 out of 10 food categories in Rubavu to a mean of 5.4 ± 1.6 food categories consumed the previous 24 h in both, Dinajpur and Rangpur (Fig. 4). A balanced diet, defined as the consumption of 5 or more food groups, was reported by 70.9% of the WRA in Dinajpur, 70.6% in Rangpur, 52.7% in Bungoma, 52.3% in Busia, 26.7% in Rubavu, and 39.3% Rusizi.
Fig. 4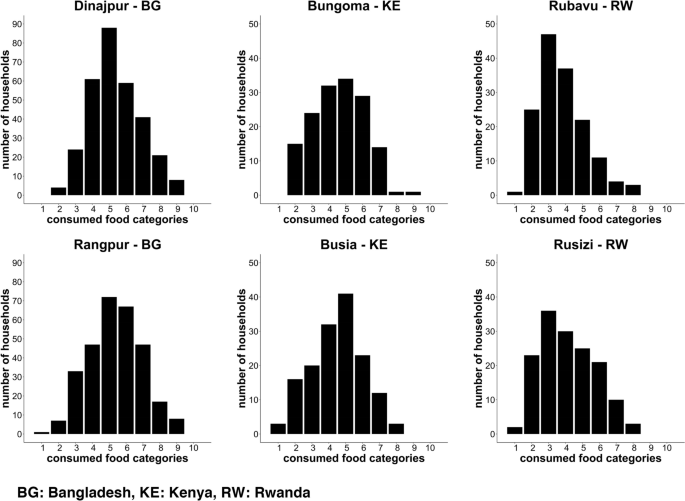

Minimum Dietary Diversity for Women score calculated for responding WRA in the NICE cities
In Bangladesh, only few WRA reported to consume supplements (7.8% in Dinajpur and 6.4% in Rangpur) and even less common was fortified weaning food such as porridge (0.6% in Dinajpur and 0.7% in Rangpur). In Kenya, one in four WRA took supplements (28.7% in Bungoma and 23.2% in Busia, containing all kind of micronutrients such as iron, zinc, folic acid, vitamin A, C, D, and multivitamins) and 34.7% in Bungoma and 25.2% in Busia gave fortified porridge to the children. In Rwanda, very few WRA reported to take supplements (5.3% in Rubavu and 2.0% in Rusizi), but 23.3% and 21.3% of the children received fortified porridge (Shisha Kibondo) in Rusizi and Rubavu, respectively.
Anthropometric measurements
Prevalence of stunting, wasting, under- and overweight in children under 5 years, are presented in Table 5. The highest rates of stunting were found in Rwanda, with almost half of the children in Rubavu being stunted and over a quarter of the children in Rusizi being too short for their age, followed by the cities in Bangladesh (Rangpur 22.0% and Dinajpur 15.7%), and the lowest prevalence of stunting in Kenya (Bungoma 12.6% and Busia 7.8%). Wasting and underweight on the other hand were lowest in Rwanda compared to Kenya and Bangladesh, where it affected up to one in seven or eight children. Overweight was overall quite low in children under 5 years. Highest prevalence was found in Rwanda, where around 10% were affected.
Table 5 Status of malnutrition in children under 5 years in the NICE cities
The rates of overweight and obesity among adolescents, youth, and adults are shown in Table 6. In Bangladesh, the prevalence of overweight and obesity was already visible in adolescents (6.0–8.0%), whereas this was rare in the African cities (0.0%-2.9%). Overweight and obesity rates in youth were higher, especially in the female population where they ranged between 12.0% in Rubavu and 18.8% in Dinajpur. For adults, again women were showing higher prevalence of overweight and overall, almost 50% of the WRA were overweight (ranging from 42.1% in Rusizi to 55.8% in Bungoma). Overweight in men was less frequent and much less homogeneous across the cities (ranging from 6.9% in Rubavu to 42.6% in Dinajpur).
Table 6 Prevalence of overweight and obesity among adolescents, youth, and adultsAntenatal care data and exclusive breastfeeding
While anemia prevalence among pregnant women varied between 9.9% in Rangpur and 30.0% in Bungoma (no prevalence calculation could be done for Rwanda due to the fact that generally no records are kept for women tested negative for anemia), percentage of low birth weight children (7).
Table 7 Exclusive breastfeeding during the first 6 months of life, low birth weight, and anemia prevalence in pregnant women
During the household visits we asked about the breastfeeding of all children under 5 years of responding WRA. Only about half of all children from the visited households have been exclusively breastfed until 6 months of age (ranging from 47.0% in Bungoma to 62.6% in Rubavu (Table 7).
Source link : https://bmcnutr.biomedcentral.com/articles/10.1186/s40795-023-00782-1
Author :
Publish date : 2023-11-04 07:00:00
Copyright for syndicated content belongs to the linked Source.