
Y-chromosome diversity on the Comoros
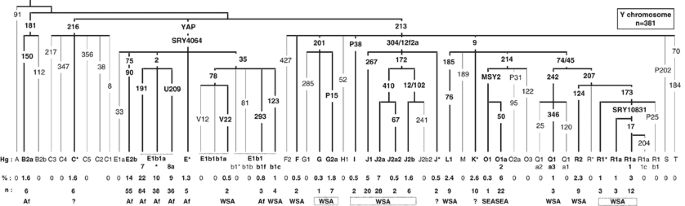
We analysed 381 Y chromosomes from the Comoros and identified 28 distinct haplogroups belonging to 11 of the 20 major clades of the Y-chromosome tree as shown below (Figure 1).20 These fall into four groups, on the basis of the geographical distribution of haplogroups around the Indian Ocean: sub-Saharan African 59.6%; Western and Southern Asia 29.7%; Southeast Asia 6% and uncertain origin 4.7%. Four clades, E, J, O and R, have frequencies greater than 5% and represent 87.4% of the sample.
The paragroups C*(xC1-5), F*(xM282, M427), J* and K*(xLMNOPQRST) cannot be assigned an origin with certainty. Nevertheless, the high frequencies of C*-M216 (Borneo – 2.5–25%) and K* (2–30%),5, 31 in SEA, make an SEA origin probable. J* has been found in Bali (1.5%) but also on the island of Soqotra (71%) situated in the Gulf of Oman between Somalia and Yemen.32, 33 F*(xM282,M427) has been found mainly in the Indian subcontinent.34 A West or Southwest Asian origin is therefore more likely for the F* and J* chromosomes.
Y-STR analysis revealed a generally high variance (Table 1), which coupled with the large number of Y haplogroups, suggesting that genetic drift has not drastically reduced genetic diversity on the Comoros Islands.
Table 1 Variance of the principal Y haplogroups (n≥5) on the Comoros based on 15 Y-microsatellite lociSub-Saharan African Y chromosomes
The most common Comorian haplogroups, E1b1-M2 (41%) and E2-M90 (14%), are those that are frequent in sub-Saharan Africa.13, 35, 36, 37, 38 They are present, respectively, at 56 and 6.4%, in Madagascar.8 Two haplogroups were identified under E1b1-M2, derived for markers M191 (22%) and U209 (9%). The haplogroup E1b1a-M191 has been found in east and west sub-Saharan Africa, 19% in Tanzania and 57% in Benin.13 The marker U209 was identified in Afro-Americans,39 and has not, until now, been tested for in African populations.
The low incidence of E-M293 (0.8%) and A-M91 (0%) on the Comoros contrasts strongly with the frequency of these haplogroups in East African populations. E-M293 is found mainly in East Africa, Kenya and Tanzania (18%).40 Furthermore, on the African mainland, M293 chromosomes carry either 10, or 13 and more repeats at the DYS389I STR locus,40 whereas on the Comoros, they have 12 repeats. Haplogroup A has a frequency of 14% in Kenyan Bantu and 7% in Tanzania.13
Other haplogroups of likely sub-Saharan African origin on the Comoros are E-SRY4064(xM2,M35,M75) (1.3%) and B2a (1.6%). B2a has a low frequency in southern Iran and Qatar,29, 41 but this is thought to be a consequence of the Arab slave trade. We therefore treat B2a as an African chromosome in this study.
Y chromosomes from around the Arabian Sea
The northern Y chromosomes on the Comoros, E-V22, E-M123, F*(xF2, GHIJK), G2a, I, J1, J2, L1, Q1a3, R1*, R1a*, R1a1 and R2 (29.7%), make up a diverse group. G2a, J1 and J2 (16.5%) are thought to have originated in the Middle East.14, 42 J1-M267 has mainly spread south and west into the Arabic Peninsula, and into North and Northeast Africa, whereas J2-M172 lineages have expanded north into Europe and east into Asia.13, 14, 41, 43, 44, 45 The M78 subclade, E-V22, and E-M123 are believed to have originated in Northeast Africa, with E-V22 spreading to the west of North Africa and to the Arabic peninsula by the Levantine corridor (United Arab Emirates (UAE) 6.7%),41, 46 whereas M123 spread mainly to the East (Yemen 8%; Oman 12%; Turkey 5.5%; Iran 1%).13, 29, 41, 42 In contrast, the haplogroups L1, Q1a3, R1, R1a, R1a1 and R2 (10.5%) are thought to be of Central or Southern Asian origin and describe clines of decreasing frequency from India and Pakistan towards the Middle East.34
A comparison of the relative incidences of E-M78(V22), E-M123, G, J, L, Q and R on the Comoros with populations around the Arabian Sea shows greatest similarities with Southern Iran and, to a lesser extent, Turkey (Supplementary Figure 2).29, 42 The higher affinity to South Iran is also evident in the MDS analysis with the Comoros Y-STR data for the E-V22, E-M123, G, J, L Q and R haplogroups (Figure 2a). In the MDS, Comoros shows greatest affinity with UAE and South Iran. Southern Iran is the site of the first towns to develop in the Southern Middle East 2000–3000 years ago (Supplementary Figure 2).
Figure 2
Multidimensional scaling (MDS) analysis plot of genetic distance (Rst) calculated from the incidence of alleles at eight Y-STR loci (DYS19, 389AB, 389CD, 390, 391, 392, 393, 439). The analysis was performed with subsets of the Comoros sample, which were created on the basis of putative haplogroup origin. (a) Middle East – haplogroups E-M123, E-V22, F, G, J, L, Q and R. (b) Southeast Asian – haplogroups O, C* and K*. The populations represented are the Comoros (COM), this study, Madagascar (MAD),8 Oman (OMA),13, 47 Turkey (TUR),42 North Pakistan (N-PAK), South Pakistan (S-PAK), North India (N-IND), South India (S-IND),34 Yemen (YEM), United Arab Emirates (UAE), Saudi Arabia (SAU),47 North Iran (N-IR),48 South Iran (S-IR),47, 48 Malaysia (MAL),49 Taiwan (Paiwan) (TAI),50 West Borneo (East Malaysia) (W-BOR)51 and Bangladesh (BAN).52
A possible source of the Northern Y chromosomes is therefore the Shirazi traders from Southern Iran who established trading posts on the Comoros by 800 YBP.12 It has previously been estimated that, at 9 Y-STR loci, 0–1 mutation will most likely separate the descendants of a single Y-chromosome haplotype after 40 generations (1000–1200 years).53, 54 Compatible with a Shirazi origin, we found that, at 9 Y-STR loci (DYS19, 389AB, 389CD, 390–393, 438 and 439), 42% of the Comoros Northern chromosomes differ by 0–1 mutation from chromosomes in Southern Iran.47, 48
SEA Y chromosomes
We found the O1 lineage (6%) in the Comoros sample, providing genetic evidence for an SEA influence. Haplogroup O has been found at highest frequencies in East Asia and Island Southeast Asia.55, 56 All but one of the Comorian O1 chromosomes are O1a-M50 (5.8%). The O1a-M50 Y chromosome has its highest incidence in SEA: Borneo (10–20%), Sulawesi (4%), Taiwanese aborigines (0–59%, mean 14%) and the Philippines (3–12%).5, 57, 58 It has not been detected in the Middle East or the Indian subcontinent.5, 29, 41, 34
We performed an MDS with our STR data for the Y haplogroups O, C* and K* together with available STR data from candidate SEA populations (Figure 2b). The Comoros show a low affinity to the populations selected, even when C* and K* are not included (not shown), suggesting that these populations are not the source of SEA chromosomes on the Comoros.
Mitochondrial diversity on the Comoros
We have tested 577 Comorian samples for mitochondrial SNPs, and we define 9 distinct haplogroups (Figure 3). As for the Y chromosome, the majority of mitochondrial haplogroups on the Comoros are of African origin. The haplogroups L0, L1, L2 and L3′4(xMN) compose 84.7% of the mitochondria in the Comoros sample, and their relative proportions are most similar to profiles found in East and South East Africa.22, 59 The higher affinity with sub-Saharan East African populations is also evident in the MDS analysis (Figure 4a and b).
Figure 3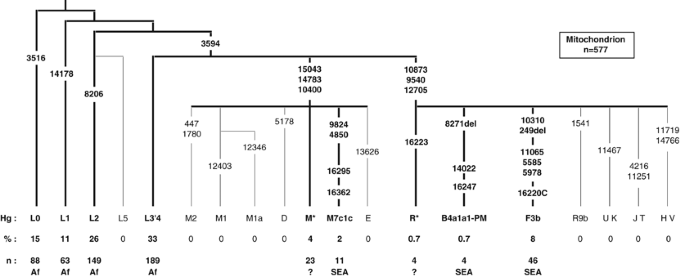

Frequencies (%) and numbers (n) of mitochondrial haplogroups in the Comoros population sample. Numbers on branches refer to the position of polymorphisms in the CRS (Cambridge reference sequence). HVS-I sequence was not determined for L0, L1, L2 or L3′4(xMN). The HVS-I SNPs are shown for M and N haplogroups, only where they provide further definition than the coding SNPs. Putative geographic origin is indicated for each haplogroup: Af – sub-Saharan Africa, SEA – Southeast Asia and ? – uncertain.
Figure 4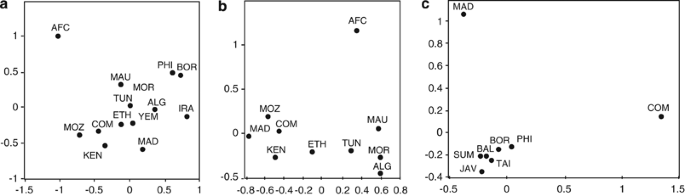

Multidimensional scaling (MDS) analysis plot of genetic distance (Fst) calculated from mitochondrial haplogroup frequencies. M* and R* were excluded from these analyses. (a) Africa, SEA and Iran – all Comoros haplogroups, except M* and R*. (b) and (c) MDS performed with subsets of the Comoros sample, defined on the basis of putative haplogroup origin. (b) Africa – Comoros haplogroups L. (c) SEA – Comoros and Madagascar haplogroups B4a, B4a1a1-PM, F3b, M7c1c and R9. The populations are Comoros (COM), this study, Madagascar (MAD),8 Central Africa (AFC),59 Iran (IRA), Mozambique (MOZ), Kenya (KEN),60 Ethopia (ETH),61 Tunisia (TUN), Algeria (ALG), Morocco (MOR), Mauritania (MAU),62 Taiwan (TAI), Philippines (PHI), Malaysia (MAL), Borneo (BOR), Sumatra (SUM), Bali (BAL) and Java (JAV).27
The remaining 15.3% of the Comoros sample is composed almost exclusively of haplogroups that can either be unambiguously identified as SEA (B4a1a1-PM, F3b and M7c1c – 10.6%),27 or fall into the paragroup M(xD, E, M1, M2, M7) (4%) (Figure 3). The latter haplogroups are probably also originally from Southeast Asia, but of the 12 different M* HVS-I sequences on the Comoros, only two match published sequences: two M(xM7) mitochondria found on Madagascar.8 We found no haplogroups that could be assigned to the Middle East.
SEA mitochondria
Of the SEA mitochondrial haplogroups present on the Comoros, F3b and M7c1c, similar to the Y-Hg O1-M50, each define an area of distribution that extends from Taiwan through the Philippines to Borneo27 (Supplementary Figure 3). The MDS analysis with SEA populations shows greatest affinity to the Philippines and Borneo, although affinity is relatively weak (Figure 4c). Linguistic studies indicate Southeast Borneo to be the probable origin of the migration from SEA to Madagascar.63 B4a1a1-PM (0.7%) is the major haplogroup throughout Polynesia (78%),31 and on Madagascar (25%), but, within island SEA, it has not been found further West than South Borneo (1%).5, 7, 8
Male-biased gene flow from the Middle East
There are no mitochondrial lineages on the Comoros that are frequent in the Middle East (Figure 3). We have tested for, but did not find, the R haplogroups, H, J, T, U and V, or N(xR) that represent 80% of the mitochondria in Iran.60 There is therefore striking evidence for male-biased gene flow from the Middle East to the Comoros, even if the unassigned mt-Hg M* and R* are designated as western Asian: 103/381 Y vs 27/577 mitochondria – Fisher’s exact test, one-sided, P−22. This is entirely consistent with male-dominated trade and religious proselytisation being the forces that drove the Middle Eastern gene flow to the Comoros. For African and SEA contributions, if Y haplogroups C* and K* are counted as SEA, the under representation of the male lineages are similar (Y to mt ratio: Africa 0.69, SEA 0.66).
An opposite female gene flow from Africa to the Middle East is clearly evident in Yemen (34% mt-Hg L; 4% Y-Hg E-M2), Iraq and the Levant.64 However, no mt-Hg L has been found in Iran (n=712),60 despite the presence of Y-Hg E-M2 (1.7%),29 supporting the idea that the elevated mt-Hg L frequency in the western Middle East is not exclusively a consequence of the Arab slave trade, but also of geography.61
Source link : https://www.nature.com/articles/ejhg2010128
Author :
Publish date : 2010-08-11 07:00:00
Copyright for syndicated content belongs to the linked Source.